TeeChart for Javascript Component
4.84/5 (400 Reviews)
Open Source JavaScript Chart Library written in 100% Javascript offers full set of chart types, maps and gauges, several chart tools for interactivity to enhance the Chart user experience and supports most popular browsers.
Development And IT
Languages And Scripts
Shareware
FREE DOWNLOAD (v2018)
File Size: 2.14MB | Safe & Verified
Key Features of TeeChart for Javascript
- Open Source Javascript / HTML5 Charting library written in 100% Javascript offers full set of chart types, maps and gauges, several Chart tools for additional charting functionality, like Annotations, Tooltips, Cursors, Dragging Points, Slider and Series Scroller.
- Plots graphs to all compatible browsers; currently supported: IE 9.0, Firefox 3.6, Chrome 16.0 , Safari 5.0, Opera 11.6, Opera-Mini 5.0, Opera Mobile 10.0, Safari 3.2, Android WebKit 2.1.
- Provides zoom and scroll support, various mouse click events and finger touch support for mobile devices.
- Set of Series types and variations includes: Line, Bar, Horiz.
- Bar, Area, Pie, Donut, Point XY, Bubble, Candle (financial OHLC), Gantt, Circular Gauge, Spark, Activity Gauge, World Maps, Polar, Polar Bar, Radar, Color Grid, Surface 3D.
- Integrated into WordPress, Drupal, Node.js, Joomla, TypeScript, NuGet among others.
Technical Specifications
- Publisher: Steema.com
- License: Shareware
- Operating System: Windows 7, Windows 8, Windows 10, Windows 11
- Category: Development And IT / Languages And Scripts
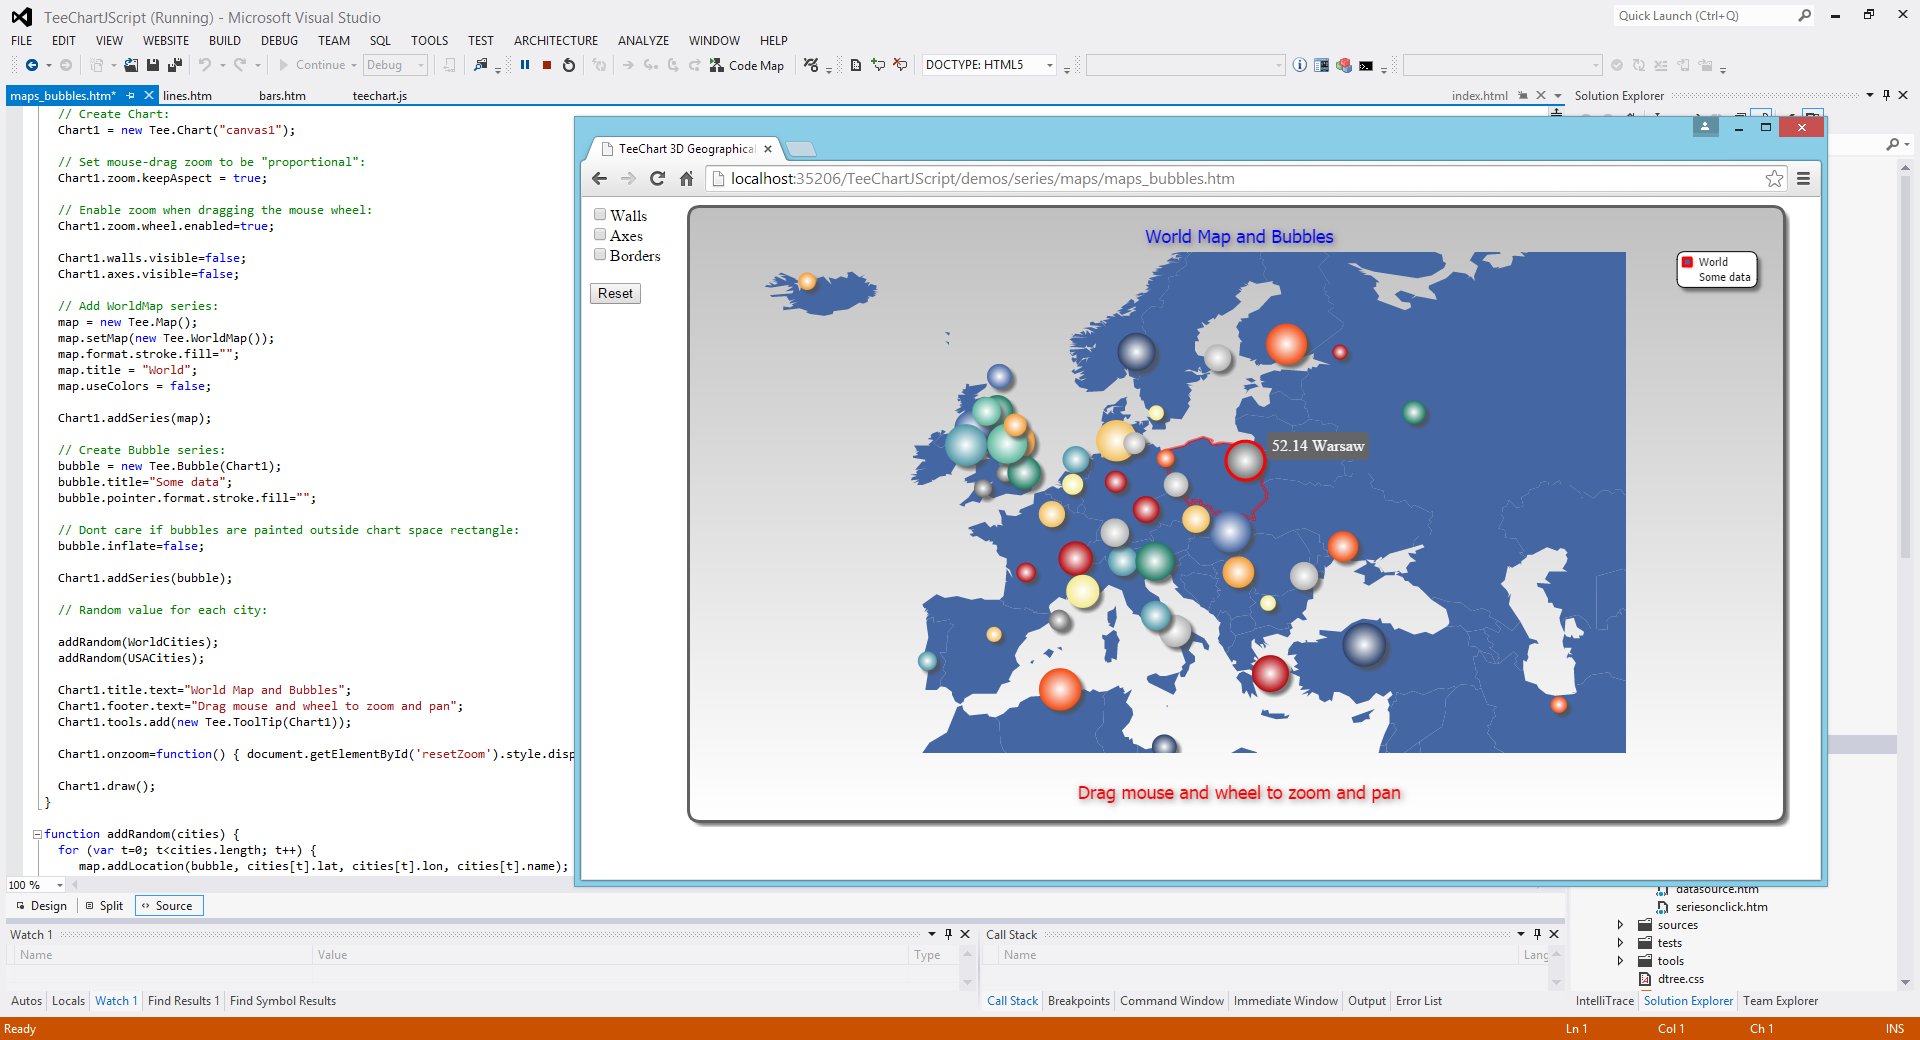
TeeChart for Javascript Screenshot