Rt Plot Graphing System
4.99/5 (27 Reviews)
Rt-Plot is a tool to generate Cartesian X/Y-plots from scientific data.
Business And Productivity
Education And Science
Shareware
FREE DOWNLOAD (v2.0)
File Size: 5.563MB | Official Download
Key Features of Rt-Plot
- Rt-Plot is a tool to generate Cartesian X/Y-plots from scientific data.
- You can enter and calculate tabular data.
- View the changing graphs, including linear and non linear regression, interpolation, differentiation and integration, during entering.
- Rt-Plot enables you to create plots fast and easily.
- The line calculations give full access to calculation and display ranges and can use statistical weights.The options can be changed interactively.
- A powerful reporting module generates ready to publish documents.
- The result on the screen is the same as on the report printout (what you see is what you get).Although the program looks simple, the graph can be altered in any item you can imagine.
- All distances in axis, scaling, numberings, captions colors, line- and point styles and colors can be altered.
- Thus a plot can be generated fitting the requirements of any journal you want to publish in and of cause your personal taste.Featuresunlimited number of data pointslive calculated data points in data tableunlimited number of graphsunlimited number of series in graphunlimited number of calculated lineslinear regressionpolynomialnon linear regressioninterpolationsmoothingdifferentialintegralcalculations can use statistical weightserror indicators at data pointsfunction interpreter for calculating columns and non linear functionsgraph fully customizablesecondary axis at top and righttwisted, log, exponential axis scalingall distances colors styles can be variedreport fully customizablebuilt in word processorincluding graph and results
Technical Specifications
- Publisher: Rt-science.de
- License: Shareware
- Operating System: Windows 7, Windows 8, Windows 10, Windows 11
- Category: Business And Productivity / Education And Science
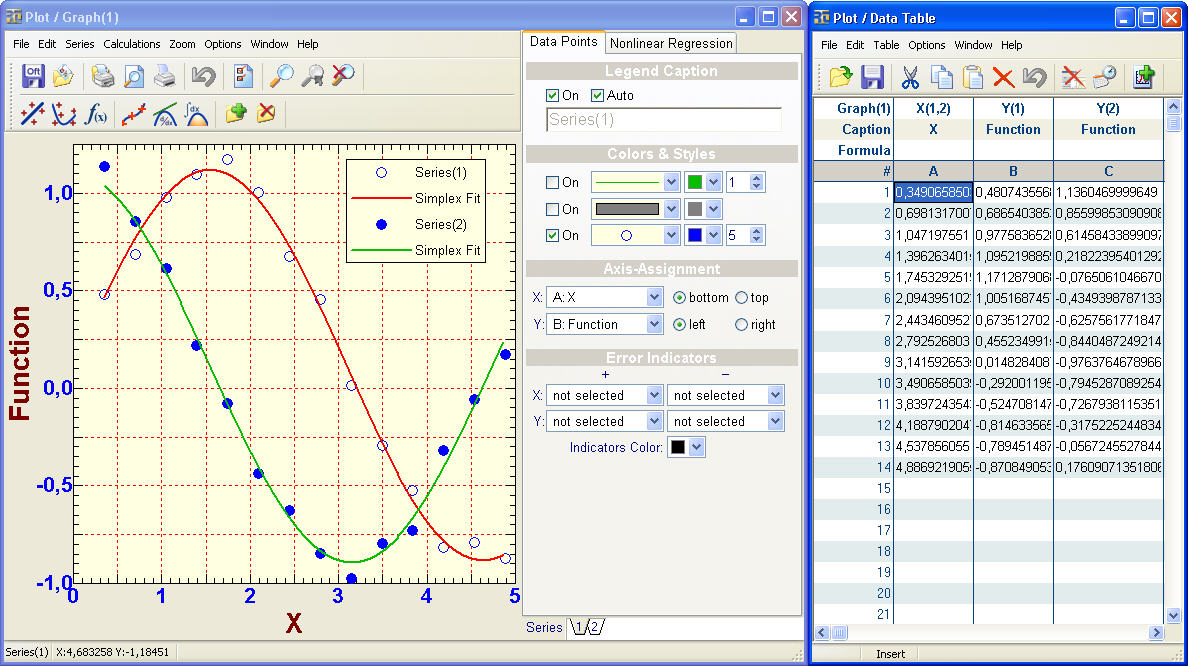
Rt-Plot Screenshot