NOV Chart for .NET Component
4.66/5 (407 Reviews)
NOV Chart for .
Development And IT
Languages And Scripts
Shareware
FREE DOWNLOAD (v2017.1)
File Size: 184.56MB | Official Download
Key Features of NOV Chart for .NET
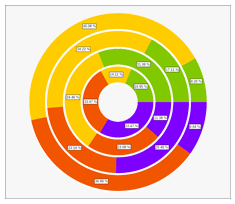
- NOV Chart for .NET is an advanced charting control for .NET, covering a vast feature set of charting types for presentational, business, scientific, financial, real-time monitoring, statistical and other types of applications.NOV Chart for .NET enables developers to create state-of-art interactive dashboards for Windows and Mac from a single code base.
- The control offers a large set of impressive features like data zooming, scrolling, panning and hit testing, blazing fast performance, superb image quality, and many others.
- Some of the major features of the Chart control are: - Complete set of 2D charting types (supports 50+ charting types).
- - Advanced chart axes model - categorical, linear, logarithmic, date time, timeline axes.
- - Resizable chart layout support with docking, anchoring, percentages etc.
- - Export to PNG, JPG, BMP, GIF, TIFF and PDF.
- - Interactivity - data zooming, data panning, axis scrolling, tooltips, hit testing etc.
Technical Specifications
- Publisher: Nevron.com
- License: Shareware
- Operating System: Windows 7, Windows 8, Windows 10, Windows 11
- Category: Development And IT / Languages And Scripts
NOV Chart for .NET Screenshot